Measuring Disaster Intensity
The Disaster Intensity Index (DII), similar to the Yew Disaster Severity Index, is created to measure disasters by an index composed of factored indicators such as time duration, media presence, the number of people impacted, damages incurred, and degrees of institutional relief/support/changes as a result of the disaster. DII is only a rough estimation as quantitative scoring presupposes subjective intervention.
| Parameter | Percentage | Score Range | Criteria |
|---|---|---|---|
| Time Duration | 30% | 1-5 | Within a day: 1 Within a week: 2 Within a month: 3 Within multiple months: 4 Year-long or longer: 5 |
| Media Presence | 15% | 1-5 | Within students: 1 Within the college: 2 Local news: 3 Regional news: 4 National news: 5 |
| Number of People Affected | 20% | 1-7 | 1≤N≤50 (or within a student group): 1 51≤N≤150 (or among multiple groups): 2 151≤N≤450 (or among class years): 3 451≤N≤1200 (or a significant majority of campus): 4 1201≤N≤2000 (or the most campus): 5 N>2000 (or the campus and affiliates): 6 N>>2000 (or all people related to Amherst): 7 |
| Damages Incurred | 15% | 1-5 | minor damage: 1 major damage: 3 psychological trauma +1 multiple damages +1 |
| Degree of Institutional Response | 20% | 1-6 | little to no response: 1 targeted response to victims: 2 general policy change: 4 structural change: 6 failed to prevent similar disasters -1 |
The Index (DII) ranges from 0 to 1. The more intense a particular disaster is for the general college community, the closer the index is to 1; The less intense, closer to 0. The midway value, 0.5, is standardized as the break-even point for “major” disasters and “minor” disasters, though a spectrum of disasters does not delineate a clear boundary between the two.
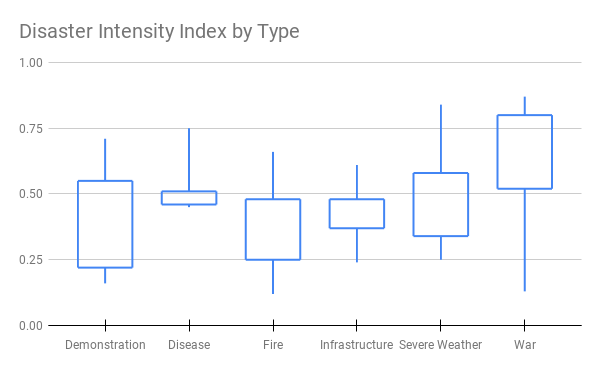
- War has the greatest range of estimated impacts on the communities, likely because some wars are only experienced by part(s) of the college community.
- Despite its highest frequency, Fire incidents show a relatively low intensity compared to disease, severe weather, demonstration, and war.
- Types whose upper bar reaches 0.5 (Major Disaster) include Demonstration, Disease, Severe Weather, and War.
- A major portion of Demonstrations was dealt with low intensity, quite similar to Fire and Infrastructure.
Below shows a bar chart indicating all disaster in the timeline (until July 15, 2020) and their DII, sorted from highest to lowest.

| DII > 0.75 Landmark Disasters | WWI The Hurricane of 1938 WWII The COVID-19 Pandemic |
|---|---|
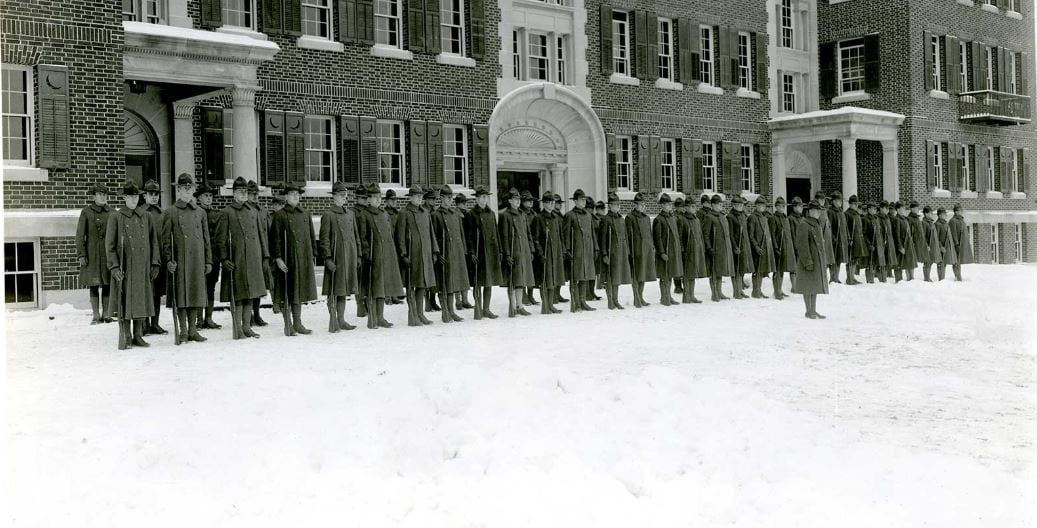
| DII > 0.5 Major Disasters | Amherst Uprising Protest against Vietnam War The First Fire of Walker Hall The Mill River Dam Disaster Storm in 1950 The North College Fire Black Lives Matter Occupation of Converse The 1862 Fire Protests of Compulsory Chapel The Civil War- Battle of New Bern Sexual Assault Scandal The 1918 Influenza The Flood of March 1936 |
You must be logged in to post a comment.